A MICROBIAL RISK ASSESSOR’S 5-DAY PERSPECTIVE ON CORONA VIRUSES
PANDEMIC
Consider evidence on the COVID-19 pandemic and perspective of a microbial risk assessor that points to decreasing fatality ratios with earlier case and contact identification, isolation, and treatment as noted by the WHO.
The COVID-19 pandemic caused by severe acute respiratory syndrome coronavirus 2 (SARS-CoV-2) is clearly impacting the lives of people all around the world. The World Health Organization (WHO) reports estimated confirmed cases world-wide totaling 193,475 as of March 18th, including 7,864 deaths (estimated overall crude fatality ratio for the pandemic approximately 4%). I commend those who are working to limit spread of this novel virus and care for those who are ill and recovering. I decided to post this summary of what I have learned in five days of investigation of research on the pandemic and SARS viruses today out of concern for those fearful of becoming ill and/or infecting others. My timeline and learnings are summarized below, with some answers to tough questions.

ON MARCH 12TH, Professor Seth Guikema, current President of the Society for Risk Analysis (SRA), organized a webinar that featured an expert panel who provided Risk Analysis Perspectives on COVID-19 Outbreak. Click below to view the 1-hour podcast from this webinar.
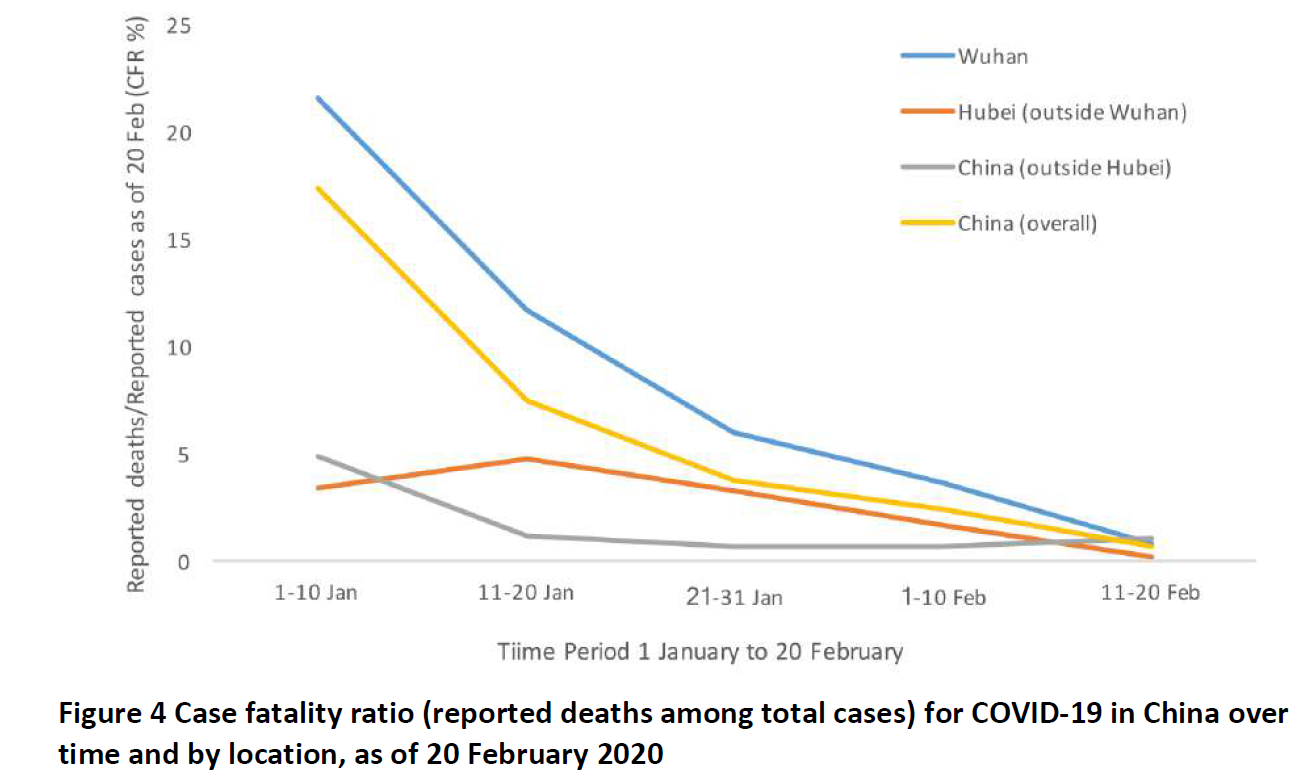
Wuhan, the capital city of Hubei Province and the most populous city in central China (>11 million), suffered a local outbreak of pneumonia identified last December that was associated with presence at the Huanan Seafood Wholesale Market. Although no animal source was identified, the virus was isolated from lung fluid samples of early cases, sequenced, and identified as a novel Coronavirus (CoV),named SARS-CoV-2. The virus spread rapidly from the epicenter in Wuhan throughout mainland China and around the world. However, the World Health Organization (WHO, 2020) reported that disease severity was highest where the outbreak started, in the epicenter at Wuhan. The crude fatality ratio for Wuhan was estimated at 5.8% as of February 24, versus 0.7 in other areas of China. Also, fatalities were highest early in the outbreak (17.3% crude fatality ratio prior to management interventions and when the local care facilities were overwhelmed, WHO Figure 4 below. Mortality was demonstrated to increase with age and with underlying medical conditions such as cardiovascular disease and chronic respiratory disease (7.6% to 13.2 %). Severity was highest among those 80 year of age or older (21.9%). WHO attributes earlier case and contact identification, isolation, and treatment as major factors contributing to consistently decreasing fatality ratios, a promising result for other countries managing the pandemic, and even severe cases recovered or were upgraded to milder disease classifications in the period of reporting.
Wuhan represented ineffective risk management, the worst-case scenario to date. Risk managers in China delayed responding to contain viral spread from the first confirmed pneumonia case in early December, 2019, until January 23rd when quarantines were enforced. By that time, more than 55,000 cases were confirmed, and a daily rate of spread was reportedly 140 new cases per day, concentrated in Wuhan but some in each Province of China. In January, cases were being confirmed around the world, predominantly associated with travel and contact with cases. Last week, Wuhan was designated a ‘high-risk area’. However, reports are consistent with decline of the outbreak in other areas considered ‘medium-’ or ‘low-risk’. Restrictions on quarantine are being lifted as the daily case rates drop. Overall, Wuhan and Hubei Province accounted for 96% of deaths in China (3111/3230 as of March 17th), while many regions reported less than 10 or no deaths. WHO (2020) emphasized to the public that the dramatic decline of the outbreak in China demonstrates that pandemic risk can be managed and that the vast majority of infected people will recover with proper precautions and case management.
The SRA webinar speakers described Singapore as representing a ‘best-case scenario’ of effective risk management where prompt response and high compliance with social distancing and quarantine instructions limited viral spread (only 266 cases) and prevented severe fatal complications (no fatalities reported to date.
ON MARCH 14TH, I accessed webpages for Health Canada and CDC for information about the pandemic in North America and updates on risk communications and case numbers. I was particularly impressed with the series of infographics provided by Health Canada. Their risk communication ‘About Corona Virus Disease (COVID-19)’ began by informing readers that ‘human corona viruses are common and typically associated with mild illnesses, similar to the common cold’. The ‘Know the Facts’ communication presents the symptoms (fever, cough, and difficulty breathing) with advice to minimize transmission. CDC also provided resources for communicating with the public about the virus and the pandemic. The ‘Share the Facts about COVID-19’ poster cautions that for most people, the risk of serious illness is thought to be low. Learn more about the virus, the disease, and protecting yourself and your neighbors by opening these attachments and sharing them with others.
ON MARCH 15TH, I was encouraged that my small local newspaper, the Syracuse Post Standard, included a 10-page special section on the pandemic. On the cover was a full page image of a masked person with the headlines: ‘PANICKED ABOUT CORONA VIRUS? STOP. TAKE OFF THE MASK. READ THIS.’ WHO and the local writer and editor agreed that masks are for sick people with symptoms of pneumonia (fever, cough, shortness of breath) to keep from spreading the virus, not for the worried well to prevent exposure to the virus that does not persist long in the air outside of droplets from the coughs and sneezes of symptomatic people near you. Social distancing (keeping 6 feet away from others) ensures that any droplets that could contain virus will not be present in your breathing zone. Much of the 10 pages of content in the local paper was consistent with the WHO report and its recommendations.
ON MARCH 17TH, I found a number of repositories of advice, research, and data on the pandemic that are freely accessible to the public.

One site is the COVID-19 Interactive Map prepared by the Johns Hopkins Corona Virus Resource Center. From this site, the table to the left reflects information for the 6 states in the US with the highest numbers of cases, as of March 17th. An additional 11 states had reported a single death in this time period but are not listed here. These data clearly demonstrate that the virus is spreading in the US, but thankfully, fatality rates in those states where fatalities occurred have not approached those of Wuhan. The elder care facilities in WA state represent the major source of fatalities in the US.
WHO Cornonavirus Disease (COVID) Outbreak Situation Dashboard for updates on cases, other information on tabs marked Your Questions Answered, Mythbusters.
NIH research on corona viruses and the pandemic
Free open resource for researchers, CORD-19 Open Research Dataset on corona virus studies, including WHO database publications. I downloaded metadata data.
ON MARCH 18TH, CDC published two reports on preliminary data for the COVID-19 pandemic in the US: disease severity by age group in the US and a report on the outbreak in the long-term care facility in WA state.
The good news from the first report is, of the 4,226 cases reported in the US since February 12th, 88% have NOT required hospitalization.
The bad news is, 31% of cases to date, 45% of the 508 hospitalized, 53% of the 121 admitted to the ICU, and 80% of deaths were older than 65 years of age. Consistent with WHO reports from China, risk of more severe outcomes increases with age as depicted in the figure below.

The second report on the 129 cases and 23 deaths among those exposed in this time period at a long-term care facility (81 of 130 residents, 34 of 170 staff members, and 14 visitors), illustrates a sobering fact: combining risk factors of a sensitive age group (>80 years old) and chronic underlying medical conditions increases the risk for severe and fatal illness. More than a quarter of those ill were also suffering from one or more of the pre-existing chronic underlying illnesses (hypertension, cardiac disease, renal disease, diabetes mellitus, obesity, or pulmonary disease as co-morbidities). Further, ineffective controls and staff members working at multiple facilities contributed to spread of the outbreak within and between facilities.
FEAR NOT TESTING POSITIVE
As data accumulate in the US from testing of nasal swabs for the presence of SARS-CoV-2, some perspective on the disease mechanism will be helpful to consider, in addition to data from WHO and CDC summarized above. The caution is that just the presence of a virus in a nasal swab sample, without symptoms of pneumonia, means only that you have been exposed, not necessarily that you are infected or that you will become ill. The points below indicate how healthy people are likely to fight off infection even if exposed to the virus.
A great deal of information is known about the initial mechanisms that corona viruses use to infect host cells, including breaking studies on binding of the pandemic virus SARS-CoV-2 to host cells. Very recently, multiple studies determined that the same receptors on human cell membranes are the targets for adherence/tethering and subsequent tighter high affinity binding of both the pandemic virus and related SARS viral strains. The CDC image below includes labels for key surface components of the virus that are essential to its ability to infect human cells, particularly the clove-shaped S glycoprotein highlighted in red.

The studies below are geared to the scientific community, but I provide links to these studies for those who would like more details about the intricate mechanisms and the sophisticated study designs that so quickly advanced knowledge about the pandemic virus.
Chen et al., 2020 (Structure Analysis of the Receptor Binding of 2019-nCoV)
Cao et al., 2020 (Comparative Genetic Analysis of the Novel Coronavirus (2019-nCoV/SARS-CoV-2) Receptor ACE2 in Different Populations)
Guo et al., 2020 (The Origin, Transmission and Clinical Therapies on Coronavirus Disease 2019 (COVID-19) Outbreak – An Update on the Status)
Quing et al., 2020 (Distinct Roles for Sialoside and Protein Receptors in Coronavirus Infection)
Song et al., 2019 (From SARS to MERS, Thrusting Coronaviruses into the Spotlight)
Lim et al., 2016 (Human Coronaviruses: A Review of Virus–Host Interactions)
Two relevant finding from these studies are of interest for the pubic. First, identifying compounds that interfere with binding of the virus (e.g., antibodies from a recovered person) is a promising strategy for designing vaccines and therapeutics to prevent future pandemics. Second, the human receptor that tightly binds virus is more highly expressed deep in the lungs (tiny air sacs or alveoli, bronchi, alveolar immune cells) than in the upper respiratory tract. It is unclear if SARS-CoV-2 infects and replicates in host cells of the upper respiratory system, but it certainly does in the deep lung tissues where the damage occurs that could lead to fatal respiratory failure. So, just presence of the virus in the nose only ensures that you’ve been exposed, not that the virus has infected your lungs.
A great desktop resource for a medical microbiologist, Schaechter’s Mechanisms of Microbial Disease, provides additional information about biological protections that limit viral spread in health humans. First, the specialized hairs in the nose (vibrissae) filter and trap particles including viruses from entering the deep lung. Next, cells lining the respiratory tract from the nose to the bronchioles in the deep lung are covered with mucous and cilia that eliminate inhaled microbes, pushing particles up the ‘escalator’ and out of the lungs (technical term, mucocilliary escalator). Anatomical characteristics of the respiratory tract also limit entry of inhaled microbes, but will not be discussed in detail here. For viruses that may make it to the deep lung alveoli, immune defenses await: antibodies, complement, alveolar macrophages that signal other immune cells to assist in removing and killing invading viruses (and bacteria). These immune defenses are also present in the mouth to process any pathogen moved up the mucocilliary escalator from the deep lung.
More recent studies (Voelker and Numata, 2019; Zhao et al., 2019; Lu et al., 2020; Varricchio et al., 2020) document in more detail the mechanisms by which our innate immune systems call on the cellular defenses mentioned above through activity of Toll-like receptors, interferon-induced transmembrane proteins, and phosopholipid to eliminate pathogens including viruses from the respiratory system.
Further, this breaking report (Thevarajan et al., 2020) documented that innate and adaptive immunity was key in recovery of a case exposed in Wuhan who traveled to Australia before illness developed. These cell types and antibodies directed against SARS-CoV-2 were detected in the blood prior to and during recovery for at least 13 days following exposure.
antibody-secreting cells (ASCs)
specific T-lymphocytes (activated CD4+ T cells; CD8+ T cells; follicular helper T cells)
immunoglobulin M (IgM) and IgG antibodies
The patient was discharged after one week of care. Changes over time (kinetics) of the sustained immune response were documented, particularly progressive increases in antibody response (both IgM and IgG) until day 20. Minimal pro-inflammatory cytokines and chemokines were detected, even during symptomatic periods at days 7-9. The authors hypothesize that understanding early adaptive immune responses might correlate with better clinical outcomes and, in the future, enhance recovery rates for severe cases of COVID-19.
Another very recent study (Guo et al., 2020) reported dramatic differences between case severity and blood chemistry and immune responses. Mild cases had normal or slightly decreased counts of white blood cells and platelets (lymphocytopenia). Severe cases had significantly higher counts of key blood components (neutrophils, D-dimer, blood urea, creatinine, interleukins IL-6 and -10, and tumor necrosis factor alpha (TNF)) and lower lymphocyte counts. In addition, ICU patients had more extreme changes in blood (higher IL-2, -7, and -10, granulocyte stimulating factor, interferon gamma induced protein, monocyte chemo-attractant proteins, macrophage inflammatory protein, and TNF) indicative of cytokine storm, septic shock, and metabolic and coagulation disorders.
MICROBIOME EFFECTS
If you know me as a scientist, you know how fascinated I am by the communities of microbes that live in and on us as partners in health: our microbiota.
You may not know that our upper and lower respiratory tracts are NOT STERILE, but have dense and diverse microbes colonizing surfaces. I encourage you to take a look at the abstracts and figures in these studies:
De Ruter et al., 2020 (Dual and Triple Epithelial Coculture Model Systems with Donor-Derived Microbiota and THP-1 Macrophages to Mimic Host-Microbe Interactions in the Human Sinonasal Cavities)
Chun et al., 2020 (Integrative Study of the Upper and Lower Airway Microbiome and Transcriptome in Asthma)
Zhang et al., 2020 (Characterization of Antibiotic Resistance and Host-Microbiome Interactions in the Human Upper Respiratory Tract during Influenza Infection)
Kumpitsch et al., 2019 (The Microbiome of the Upper Respiratory Tract in Health and Disease)
I am pleased to connect you with Professor Glenn Gibson, Food Microbial Sciences Unit, University of Reading, UK, through his blog Can Probiotics and Prebiotics go Viral?. In the blog, Prof. Gibson cites this double blind, randomized human clinical trial (deVrese et al., 2005) that concluded that ingestion of a specific probiotic product for 3 months shortened common cold episodes by nearly 2 days and reduced the severity of symptoms.
Prof. Gibson’s blog next mentions a more recent systematic review of multiple studies (Hao et al., 2015; Probiotics for Preventing Acute Upper Respiratory Tract Infections) that concluded ‘Probiotics were found to be better than placebo in reducing the number of participants experiencing episodes of acute [upper respiratory tract infections] URTI by about 47% and the duration of an episode of acute URTI by about 1.89 days.’
Also relevant to this conversation are a tremendous number of recent studies that document connections between the gut microbiota and dietary choices on risks of respiratory tract diseases. I highlight these studies below but invite you to contact me for more information.
Tromp et al., 2020 (Breastfeeding and the Risk of Respiratory Tract Infections after Infancy: The Generation R Study)
Van der Gaag et al., 2020 (Influence of Dietary Advice Including Green Vegetables, Beef, and Whole Dairy Products on Recurrent Upper Respiratory Tract Infections in Children: A Randomized Controlled Trial)
Perdijk et al., 2018 (Cow’s Milk and Immune Function in the Respiratory Tract: Potential Mechanisms)
Shida et al., 2017 (Daily Intake of Fermented Milk with Lactobacillus casei strain Shirota Reduces the Incidence and Duration of Upper Respiratory Tract Infections in Healthy Middle‑Aged Office Workers)
Loss et al., 2015 (Consumption of Unprocessed Cow’s Milk Protects Infants from Common Respiratory Infections)
BOTTOM LINE
I repeat, fear not. Social distancing and quarantine are well documented to reduce the likelihood of both exposure and illness, particularly severe illness. Even if your nasal swab tests positive for the pandemic virus SARS-CoV-2, early detection and proper care are likely to bring you to full recovery without complications involving severe pulmonary distress. WHO (2020), Figure 6A below illustrates the ‘worst-case’ scenario to date where delayed social distancing and quarantine caused high case numbers (nearly 3,000 per day for about a week at the peak in the second phase of the outbreak) that overwhelmed local resources and contributed to high local fatality rates early in the outbreak expanding from Wuhan.
